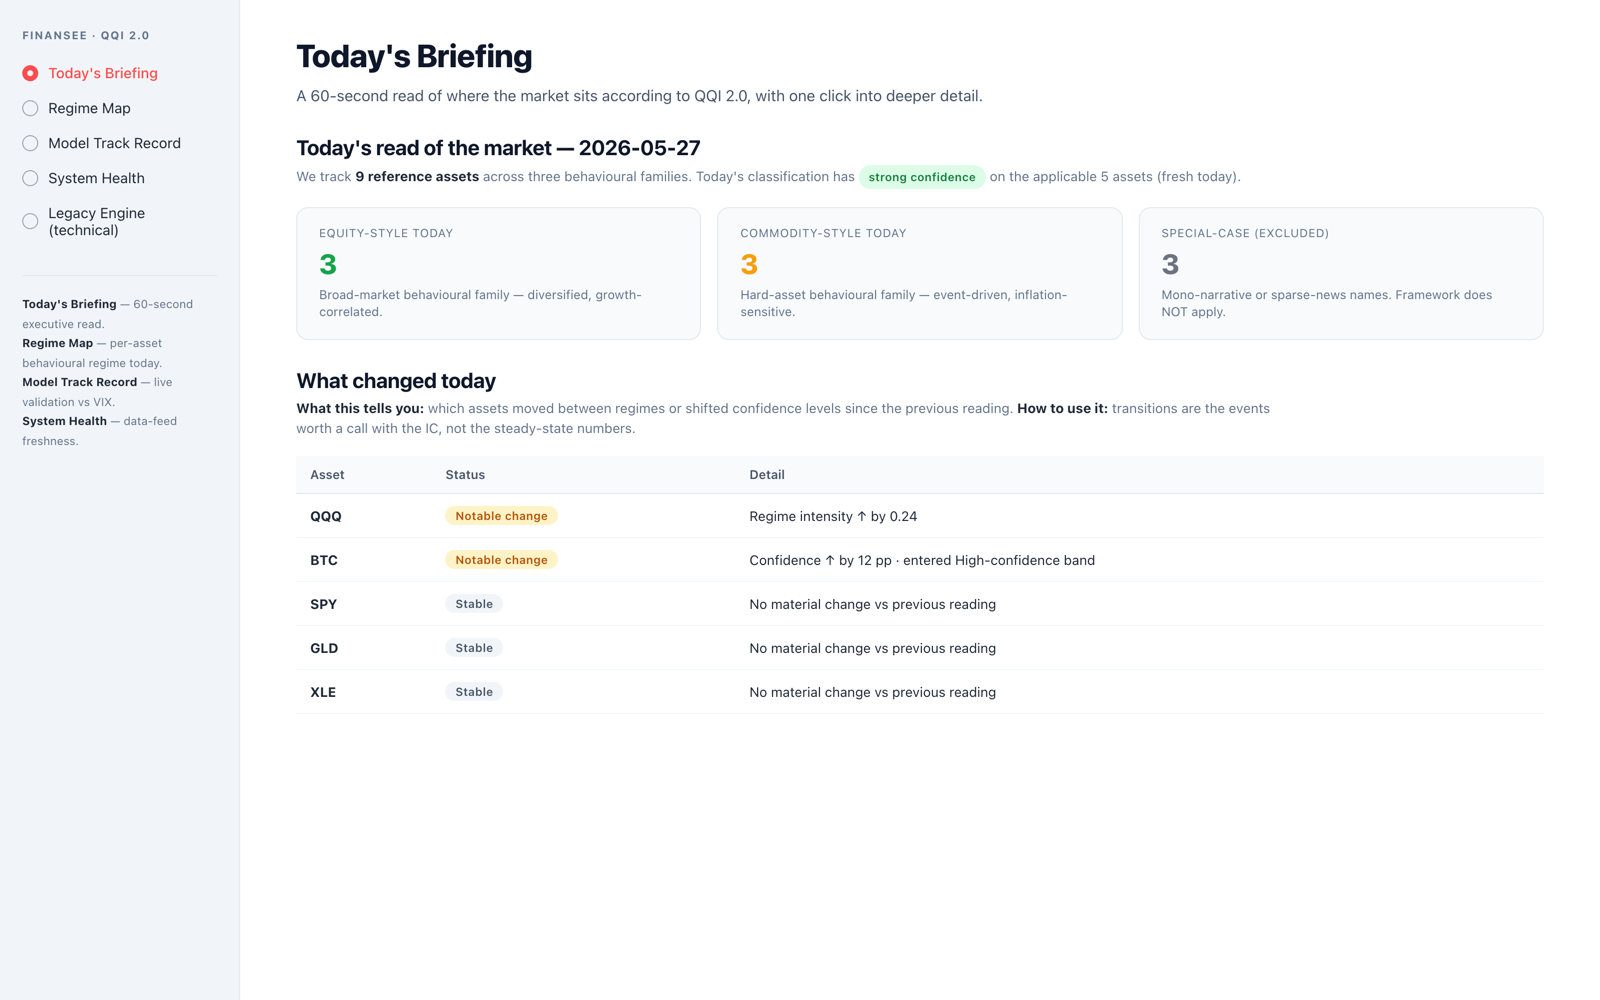
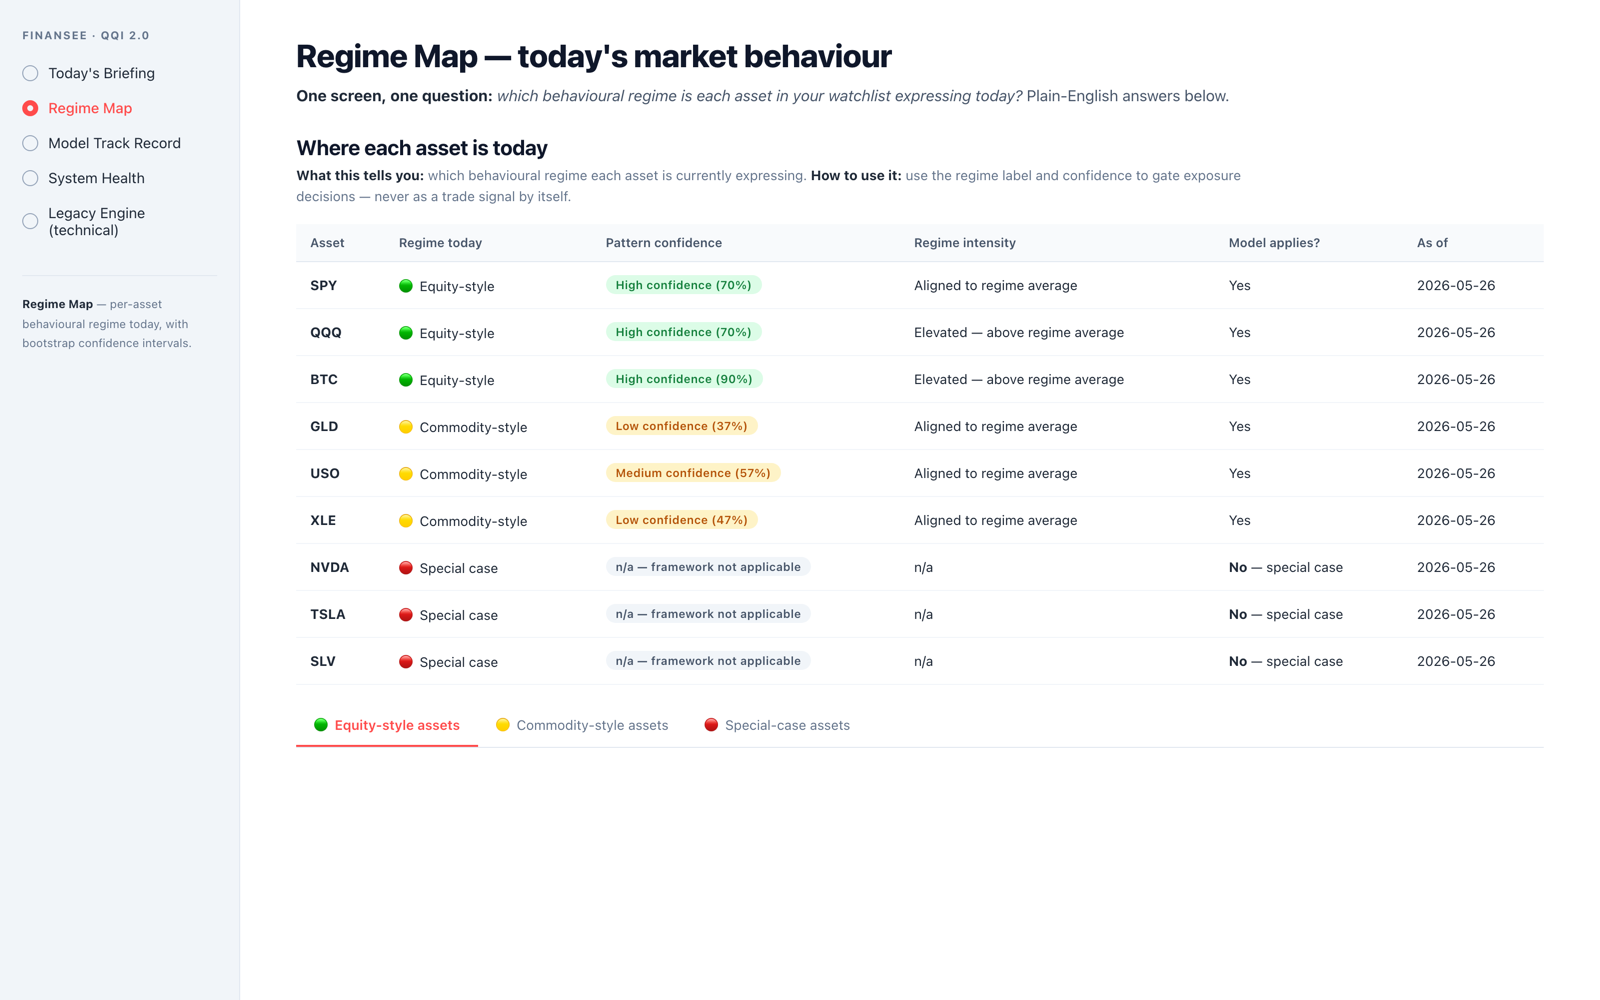
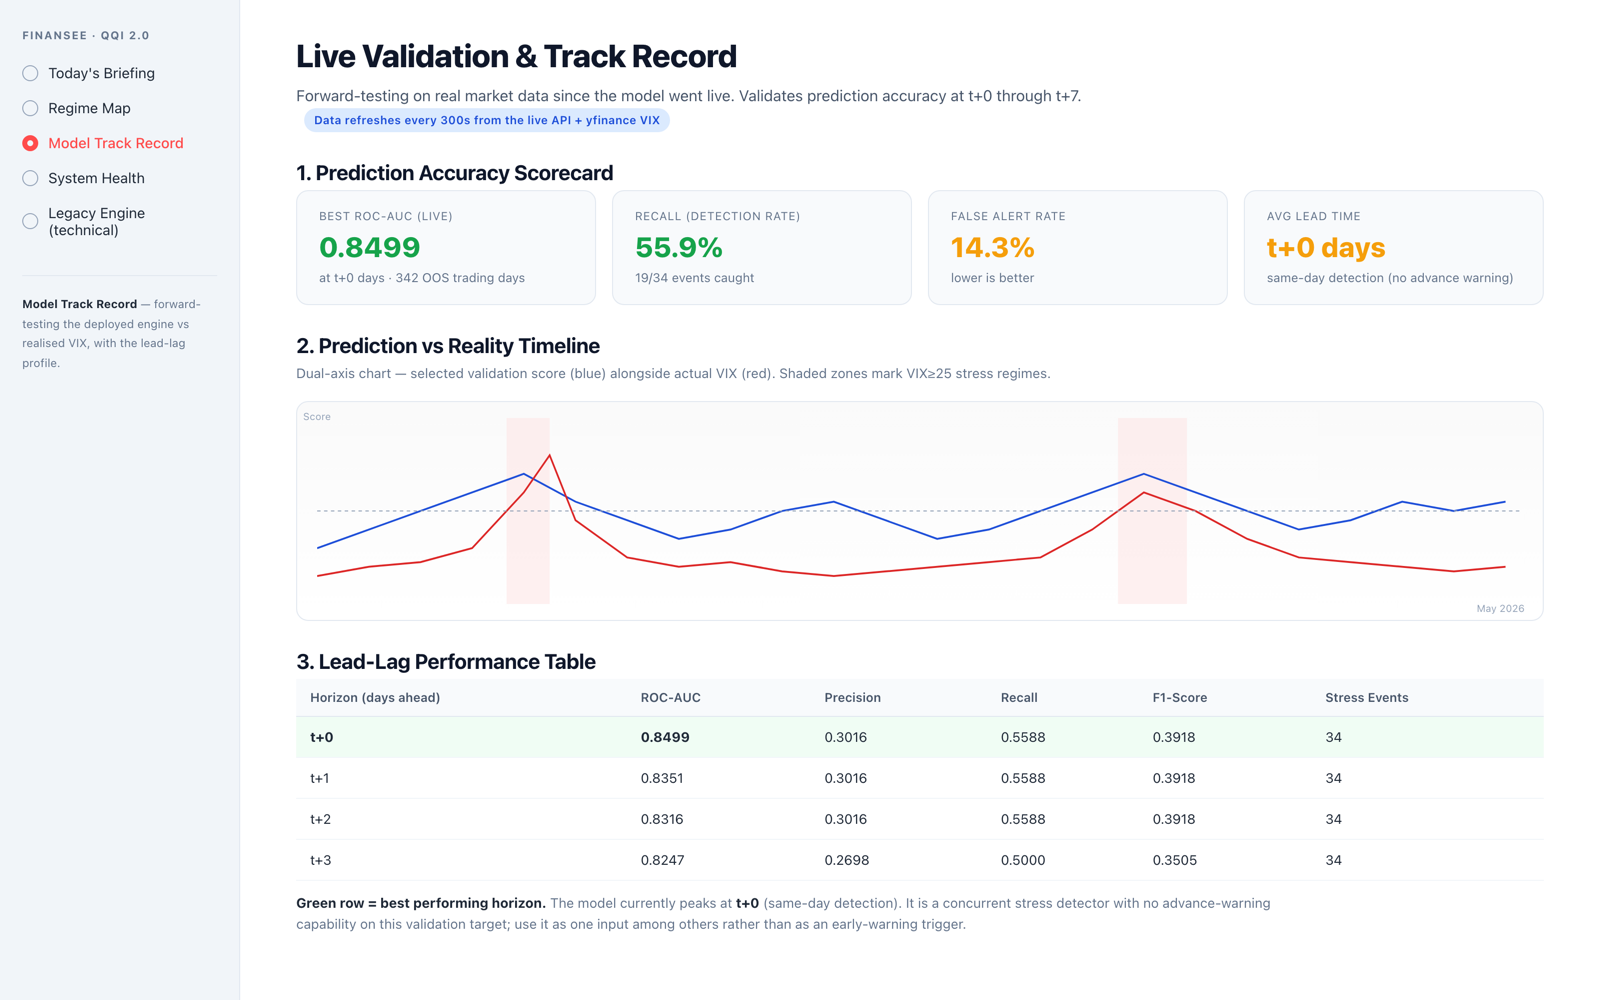
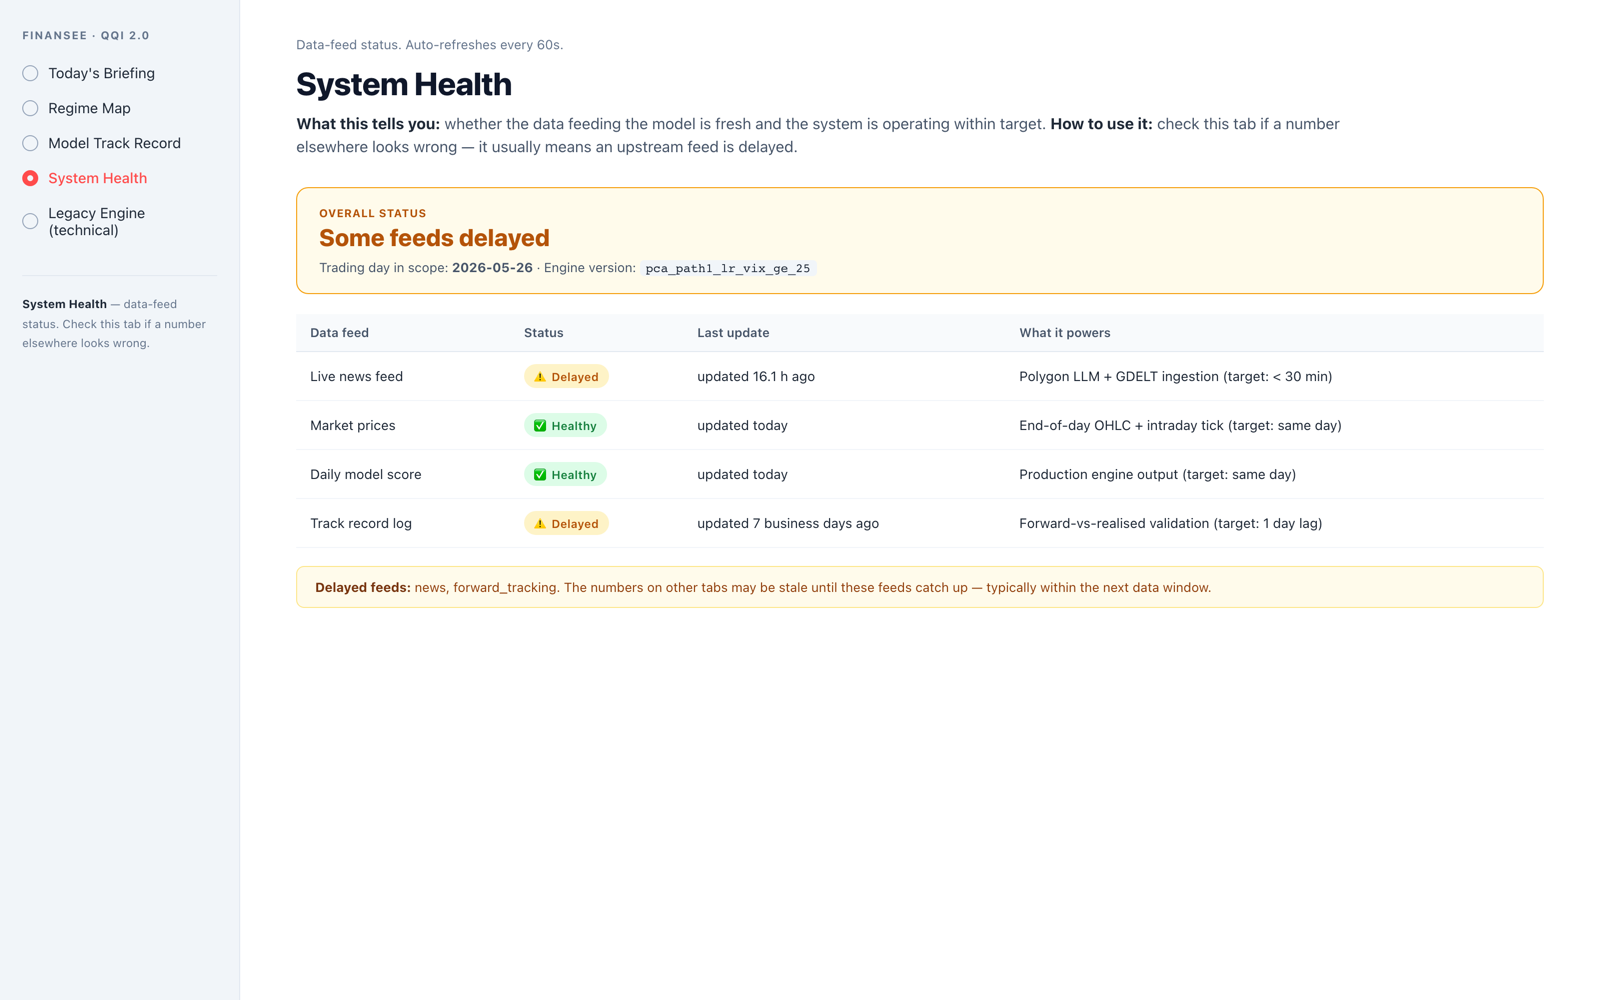
QQI 2.0 maps each financial asset to a (j, q) coordinate
of the SUq(2) quantum group — in real time, with
bootstrap confidence intervals and an explicit flag for when the
framework does not apply. A vector instead of a
sentiment scalar. Honest scope instead of alpha hype.
Every existing market-sentiment indicator collapses multi-dimensional market structure into a single scalar — and quietly fails when you most need it.
RavenPack, MarketPsych, Bloomberg sentiment: one number, no uncertainty, opaque scope, trained on regimes that no longer hold. Desks gate strategies on indicators that crashed in 2022, 2023, 2024 without explaining why.
A live (j, q) coordinate per asset, three-cluster classification with bootstrap CIs, and an automatic applicability flag when the framework breaks: pre-mid-2010 acute-GFC windows, empirically single-state tickers, sparse-news assets. No alpha hype.
QQI 2.0 is the institutional product line of the FinanSee behavioral-finance engine. Four audiences, one math.
Six structural differences. Each is verifiable from the open code and preprint.
Competitors output one sentiment number. QQI ships a (j, q) coordinate plus cluster plus 95% bootstrap CI plus applicability flag on every measurement.
SUq(2) recoupling theory predicts scale ratios that match empirical data within 1%. The same algebra underlying topological quantum computing — not analogy.
Our research falsified return prediction on 9 of 11 task variants. We say so openly. Framework does not apply to pre-mid-2010 acute-GFC windows, empirically single-state tickers, or sparse-news assets. Stated upfront.
No single-shot estimates ever shipped as truth. Every (j, q) value carries a 95% confidence interval. Every cluster comes with a bimodality detection rate.
τdec ≈ 100s is the dealer inventory cycle, anchored to Bouchaud's propagator model — not a marketing observable invented to sound sophisticated.
arXiv preprint, 16/16 unit tests, public code. Auditable in a way no proprietary "sentiment AI" has ever matched. Built to be falsified, not to impress.
Six results, all reproducible from the public code and preprint (forthcoming arXiv q-fin.ST).
Daily forward-stress mutual information peaks at h ≈ 2d and h ≈ 30d across three independent observational scales (time-domain MI, intraday LLM sentiment, partition function Var(n)).
All three empirical scale ratios match within 1% via q-6j-symbols with scale-running deformation q(intraday)≈1.01, q(daily)≈1.31, q(T-QUBO)≈0.86.
Three empirical (j, q) points fit exactly the quadratic q(j) = -0.04 + 2.85j - 1.50j², whose two fixed points (j=0.49, 1.41) and extremum (j=0.95) coincide with our empirical anchors within 7%.
Cross-asset bootstrap on 11 baskets identifies Equity-Index (j=1, q≈1.4), Commodity (j=1/2, q≈2.0), and Single-State (framework not applicable).
SPY tick autocorrelation reveals τA < 1 ms (microstructure), τB ≈ 106s (dealer inventory cycle), τM ≈ 15 min (information assimilation). Literature-anchored to Bouchaud's propagator model.
Bimodal regime emerged with post-GFC volatility stabilisation: 31 of 34 rolling 2-year windows post-mid-2010 show detection rate ≥ 0.7. Falsifiable boundary: framework does not apply to pre-2010-Q3 acute-GFC windows. Our prior "2014 break" claim was refuted by Bai-Perron + Chow + CUSUM (Track A, preprint D1).
Interactive — hover for confidence intervals. From cross-asset v3, 11 baskets, bootstrap 30×.
★ Equity-Index cluster centered at (j=1, q≈1.4): SPY (1.31), QQQ (1.45±0.17), BTCext (1.42±0.20) — first quantitative universality result.
Commodity cluster at (j=1/2, q≈2.0-2.6): GLD, USO, XLE share fundamental representation with elevated deformation.
Single-state (framework not applicable): TLT, SLV (sparse-news), NVDA, TSLA (empirically single-state). The underlying mechanism is an active research question — our prior semantic-topic-concentration hypothesis was refuted (Track A, FinBERT test, ρ=−0.12, p=0.77).
Four views, four jobs to be done — plain English everywhere, technical detail behind expanders for the curious.
Console access is granted to Founding Pilot partners after onboarding. Pilot scope agreed upfront — see the section below.
QQI 2.0 is in evaluation. We are onboarding the first 10 institutional partners to test the product in production conditions before publishing commercial pricing.
No. QQI is a descriptive indicator of the current (j, q) state of the financial spin network. We make no return-prediction claim. Our research falsified that hypothesis on 9 of 11 task variants we tested; we say so openly.
The framework is built on the SUq(2) quantum
group — the same algebraic structure underlying topological quantum
computing and loop quantum gravity. Our 6j-symbol predictions match
empirical scale ratios within 1%. This is not analogy or marketing —
it's the actual mathematics.
Three documented limits:
All three are flagged automatically in the dashboard.
Existing sentiment indicators are scalar (one number) and typically claim alpha. QQI is vector: a (j, q) coordinate with confidence intervals, a cluster classification, and an applicability flag — and it does not claim alpha. It tells you what regime the market is in, not where it's going.
Yes. The full research record is open:
QQI 2.0 is in evaluation. We're onboarding 10 founding pilot partners (family offices, hedge funds, structured-product desks) for a 90-day, scope-defined evaluation before publishing commercial pricing.
90-day evaluation · pilot scope agreed upfront · we reply within 24h. Commercial pricing intentionally not published yet — pilot partners help shape it.